Section 8.4 Shear and Bending Moment Diagrams
The previous section addressed a method to find shear and bending moment at a single point, which is useful, but this technique is of little use if you want to know the shear and moment at every point in the object. Shear and bending moment diagrams are a way for us to do that, easily.
For the remainder of this chapter, we will limit our analysis to beams, which are structural elements primarily designed to support vertical loads. When designing a beam it is important to locate the points of maximum shear and maximum moment and their magnitudes because that's where it is most likely to fail. To find these weak points, we need to check the internal loading at every point along the beam's full length. We use shear and bending moment diagrams to do this.
You will learn three related but different methods to produce shear and bending moment diagrams, and the chapter will conclude with a comparison of the advantages and disadvantages of each method.
Subsection 8.4.1 Shear and Bending Moment Diagrams
Shear and moment diagrams are graphs of the internal shear and bending moment plotted along the length of the beam. They allow us to find where the maximum loads occur in order to prevent failure and to optimize the design to reduce the overall weight and cost of a structure.
Since beams primarily support vertical loads, the normal forces are small and also independent of shear and moment, so they will not be considered in this section.
Beams can be supported in a variety of ways as shown in Figure 8.4.1. Beam support types include:
- a simply supported beam with a pin on one end and a roller at the other,
- a cantilevered beam which is fixed on one end, and
- an overhanging beam which acts as a combination of a simply supported and cantilever beam.

Subsection 8.4.2 Section Cut Method
In this section we'll extend the previous method where we found internal loadings at a specific point to find the internal load at every point by developing equations, by cutting at an variable location \(x\text{.}\)
The difference between cutting a beam at a specific point, and cutting at point \(x\) is that the resulting equilibrium equations will include \(x\) rather than a known distance, and the resulting equations for shear and moment will be functions of \(x\text{.}\) To find the internal loads at a specific point we can just substitute in that point's location for \(x\text{.}\)
As an example, we will use a cantilevered beam fixed to a wall on its left end and subject to a vertical force \(P\) on its right end as an example.
By taking a cut at a location a distance \(x\) from the left we can draw two free-body diagrams with lengths \(x\) and \((L-x)\text{.}\) This beam has one loading segment, because no matter where \(x\) is chosen, the free-body diagrams shown in Figure 8.4.2 are correct.
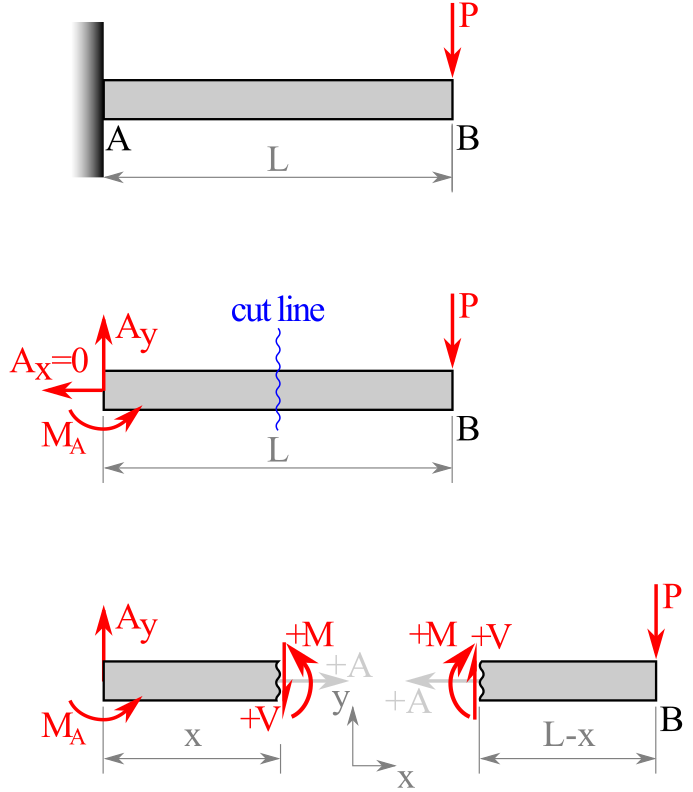
To find the shear and loading functions, apply the equilibrium to one of the free-body diagrams. Either side will work, so we’ll select the right-hand portion as it doesn’t require us to find the reactions at \(A\text{.}\)
Using a standard coordinate system, the equations of equilibrium are:
where \(L\) is the length of the beam.
We can solve these to find that \(V=P\) and \(M=-P(x-L)\text{.}\) This indicates that the shear force \(V\) is constant over the length of the beam and the moment \(M\) is a linear function of location \(x\text{.}\)
This example was simple because because only one FBD was necessary for any point on the beam. But many beams are more complex than this one. Beams with multiple loads must be broken into loading segments between each point where a load is applied or changes.
The beam in Figure 8.4.3 has three loading segments but the procedure is similar, however in this case you must draw and analyze three free-body diagrams, one for each segment.
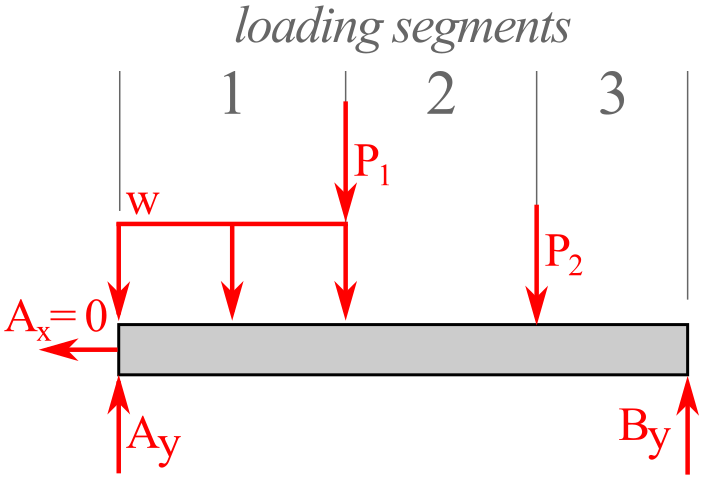
If we make an imaginary cut through the second segment, we can draw a new free-body diagram of the segment to the left of the cut as shown in Figure 8.4.4
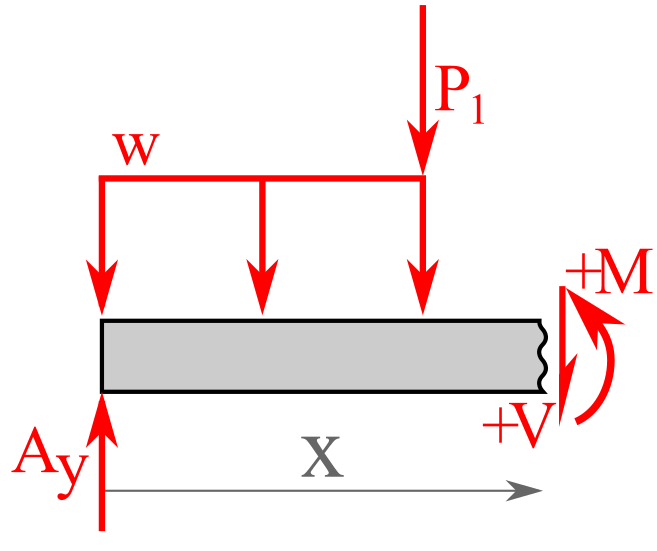
The equations of \(V\) and \(M\) from each segment are joined to plot the shear and moment diagrams. These diagrams help us visualize the change in the values of \(V\) and \(M\) everywhere within the beam.
When writing equations for loading segments, you may choose either
- global equations— all segments use the same origin, usually at the left end of the beam.
- local equations— each segment uses its own origin, usually at the left end of the segment.
Often local equations are easier because you can simply use the variable \(x\) in your equations as opposed to “\(x\) + constant”, and you do not have to project the \(y\)-intercept values back to an axis system which is not adjacent to the segment.
Notice as you change the slope, global intercept, and location of point \(A\) that the only values that shift between local and global equations are the \(y\) intercept values (\(b_\text{local}\) vs. \(b_\text{global}\)) and the x coordinate of \(A\text{.}\)
Subsection 8.4.3 Graphical Method
Subsubsection Relation Between Loading, Shear and Moment
Suppose that we have a simply supported beam upon which there is an applied load \(w(x)\) which is distributed on the beam by some function of position, \(x\text{,}\) as shown in Figure 8.4.6.
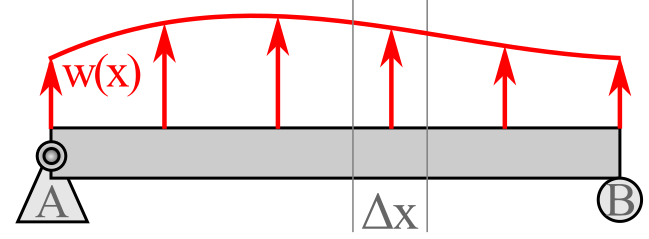
If we select a small section of this beam to look at closely, we can assume a free-body diagram such as shown in Figure 8.4.7.
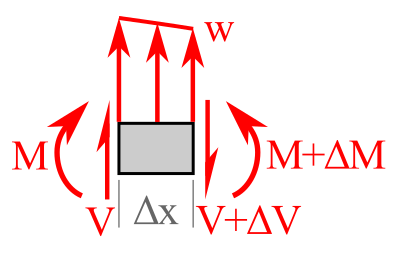
Apply force equilibrium in the vertical direction gives allows us to make the following derivation:
This final equation tells us that, at a given location, the slope of the shear V is the value of the loading \(w\text{.}\) Furthermore, if we multiply both sides by \(dx\text{,}\) we can integrate to find that
In words, this equation says that over a given distance, the change in the shear \(V\) is the area under the loading curve, \(w\text{.}\)
Now looking at the internal bending moments on the FBD in Figure 8.4.7, when we apply moment equilibrium about the centroid \(G\) of the element:
This final equation tells us that, the slope of the moment diagram is the value of the shear. Furthermore, if we multiply both sides by \(dx\text{,}\) we can integrate to find that
In words, this equation says that over a given segment, the change in the moment value is the area under the shear curve.
Hence, your loading, shear, and moment are related directly by the basic derivatives and integrals that you learned in Calculus I. These relationships are summarized in Table 8.4.8 below.
Relating |
Derivatives (slopes) |
Integrals (areas) |
Loading function \(w(x)\) with shear function \(V(x\)) |
\begin{equation}
\frac {dV}{dx}=w(x)\tag{8.4.1}
\end{equation}
The slope of the shear diagram at \(x\) is the value of the loading function at \(x\text{.}\) |
\begin{equation}
\Delta V=\int w(x)\ dx\tag{8.4.2}
\end{equation}
The change in the shear diagram is the area under the loading function. |
Shear function \(V(x)\) with moment function \(M(x)\) |
\begin{equation}
\frac {dM}{dx}=V(x)\tag{8.4.3}
\end{equation}
The slope of the moment diagram is the value of the shear at the same position. |
\begin{equation}
\Delta M=\int V(x)\ dx\tag{8.4.4}
\end{equation}
The change in the moment between two points is the area under the shear curve. |
Subsubsection Application of the graphical mentod
This graphical technique is a quick and intuitive way to draw shear and moment diagrams. This technique is really a graphical integration process; you integrate from load \(w(x)\) to shear \(V(x)\) to moment \(M(x)\text{,}\) from top to bottom. You have derivatives the other direction.
The curves show the relationships between loading, shear, and moment of each diagram with jumps, slopes, and areas.
- Jumps— vertical changes in shear and moment diagrams.
- Slopes— gradual changes in shear and moment diagrams.
- Areas—“areas” under the load and shear curves. The area under the loading curve is actually a force, and the area under the shear curve is a moment.
Table 8.4.9 Summarize the relationships between load, shear and moment. You can explore the behavior using the interactive in Figure 8.4.10.
Load |
Jumps |
Slopes |
Areas |
Shear |
Concentrated loads cause the shear to jump by the same amount. Upward loads cause upward jumps. |
The value of the load is the slope of the shear. |
The change in the shear is equal to the area under the loading curve. \(\Delta V=\int w(x) dx\) |
Moment |
Concentrated moments on the beam have no effect on the shear curve, but cause jumps on the moment curve. Counterclockwise moments cause upward jumps and vice-versa. |
The value of shear at a point is the slope of the moment at that point. \(V\) = \(+ M\) slope (↗) \(V = − M\) slope (↘) |
Change in the moment is equal to the area under a shear curve. \(M=\int V dx\) |
Subsubsection Step-by-step
Shear and bending moment diagrams are governed by these equations and must be consistent with them.
First, determine the reaction forces and moments by drawing a free-body diagram of the entire beam and applying the equilibrium equations. Double check that your reactions are correct.
Establish the shear graph with a horizontal axis below the beam and a vertical axis to represent shear. Positive shears will be plotted above the \(x\)axis and negative below.
Make vertical lines at all the “interesting points”, i.e. points where concentrated forces or moments act on the beam and at the beginning and end of any distributed loads. This divides the beam into segments between vertical lines.
-
Draw the shear diagram by starting with a dot at \(x = 0\text{,}\) \(V = 0\) then proceeding from left to right until you reach the end of the beam. Choose and label a scale which keeps the diagram a reasonable size.
Whenever you encounter a concentrated force, jump up or down by that value.
Whenever you encounter a concentrated moment, do not jump.
Whenever you encounter a distributed load, move up or down by the “area” under the loading curve over the length of the segment, according to equation 2. The “area” is actually a force.
The slope of the curve at each point \(x\) is given by equation 1. Distributed loads cause the shear diagram to have a slope equal to the negative value of the load at that point. For unloaded segments of the beam, the slope is zero, i.e. the shear curve is horizontal. For segments with uniformly distributed load, the slope is constant.
The shear diagram should start and end at \(V = 0\text{.}\) If it doesn’t, recheck your work.
Add another interesting point wherever the shear diagram crosses the \(x\)-axis, and determine the \(x\) position of the zero crossing.
After you have completed the shear diagram, calculate the area under the shear curve for each segment. Areas above the axis are positive, areas below the axis are negative. The areas represent moments and the sum of the areas plus the values of any concentrated moments should add to zero. If they don’t, then recheck your work.
Establish the moment graph with a horizontal axis below the shear diagram and a vertical axis to represent moment. Positive moments will be plotted above the x-axis and negative below.
-
Draw and label dots on the moment diagram by starting with a dot at \(x = 0, M = 0\) then proceed from left to right placing dots until you reach the end of the beam. As you move over each segment move up or down from the current value by the “area” under the shear curve for that segment and place a dot on the graph. In this step, you are applying equation 4.
Positive areas cause the moment to increase, negative areas cause it to decrease.
If you encounter a concentrated moment, jump straight up or down by the amount of the moment and place a dot. Clockwise moments cause upward jumps and counterclockwise moments cause downward jumps.
When you reach the end of the beam you should return to \(M = 0\text{.}\) If you don’t, then recheck your work.
Connect the dots with correctly shaped lines. Segments under constant shear are straight lines, segments under changing shear are curves. The general curvature of the lines can be determined by considering equation 3.
Every shear and bending moment diagram problem should include:
- A neat, accurate, labeled free-body diagram of the entire structure, and the work to find the reactions. For this work, you may replace the distributed loads with equivalent concentrated loads.
- A neat, properly scaled diagram of the beam showing its reactions and “true” loads. Distributed loads must be shown this diagram, because their distributed nature is significant.
- A large graph of the shear and bending moment functions drawn directly below the scaled beam diagram. It is convenient to draw this graph on graph paper.
- Show the correct shape and curvature for each curve segment: zero, constant slope, polynomial. Changes in curve shapes should align with the load which causes them. Indicate the scale used for shear and moment, and use a straightedge.
- Indicate values of shear and moment at maximums, minimums and points of inflection
- Any other work need to justify your results.
Subsection 8.4.4 Calculus Method
In Table 8.4.8 we learned that loading, shear and bending moments are related by integral and differential equation, and used this knowledge to draw shear and bending moment diagram suing a graphical approach. This method is easy and fast in cases when you can easily calculate the areas under the loading and shear curves without integration.
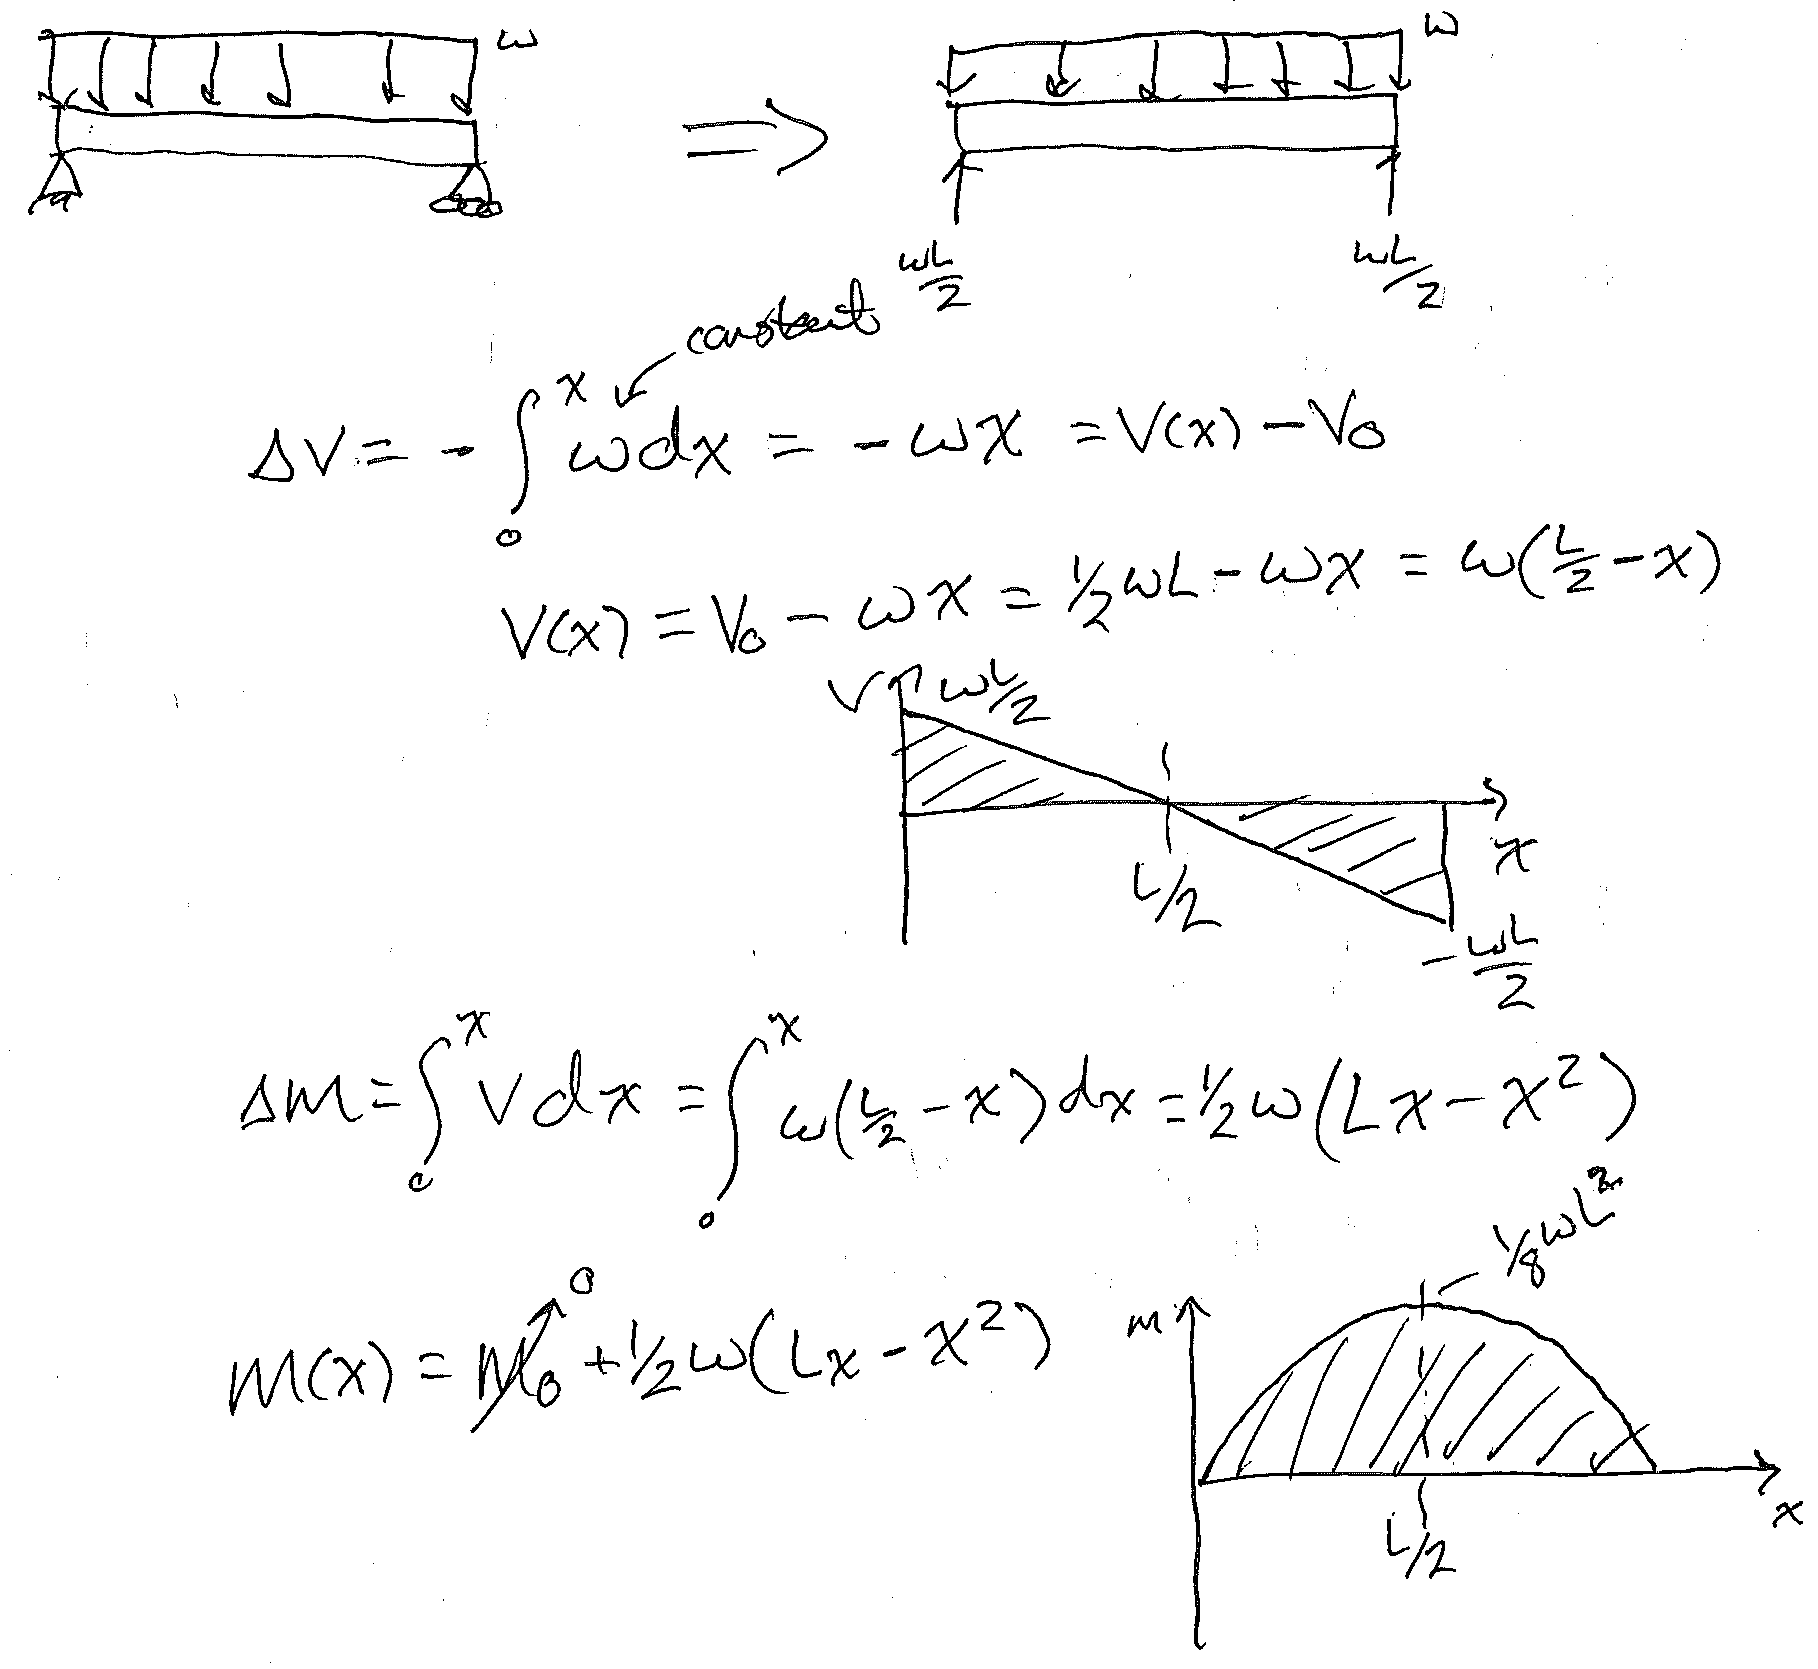
However, there are times that the graphical technique falls short when the areas are more complicated than rectangles or triangles. For example, a uniformly varying load, which is a 1st-degree linear function of \(x\text{,}\) integrates to a 2nd-degree parabolic shear function, and a 3rd degree cubic moment function. To use the graphical method you will need to find the area under the parabolic shear curve to compute the cubic moment. When the loading becomes more complex it is better to use perform the integration directly.
We use the same fundamental equations in this section as you used in the graphical method
But, instead of finding areas and slopes you will obtain an equation for the load as a function of \(x\text{,}\) then integrate it to find the shear function. The integral equations are the change in the shear and moment, thus you will need starting values for each segment.
The starting values come from either the ending value of the previous segment or point loads or point moments. Because of the requirement for these segment starting values, no segment can be computed in isolation from the other segments. Physically this means that the shear and moment along a beam are not just due to the loading in one segment, but are related to the loading on the rest of the beam as well.
Loading type in a segment |
Equation | Description |
| between point loads | \(w=0\) |
load between point loads will result in no change in the shear (\(V\)) between point loads (only happens when self-weight of the beam is ignored) |
distributed loads (rectangular area) |
constant value |
value is negative (-) if the load is downward (↓) and positive (+) if the load is upward (↑) |
changing loads (triangular or trapezoidal area) |
\(= mx + b\) | defined by the arrow tips of the distributed load = slope (rise/run) = distance from datum (global or local to segment, see Global vs Local functions for segment equations above) \(= y-intercept @ x = 0\) |
other loading distribution |
\(= f(x)\) |
defined by the arrow tips of the distributed load Note that point and uniformly distributed loads can easily be handled with the graphical method and do not require the use of the calculus method. As most gravitational distributed loads are drawn with the arrows pointing down and resting on the beam, slide distributed loads along their line of action so that their tails are on the beam and their tips define your equation. |
Subsubsection Application of the Calculus Method
Now
You can either start with this method from the start of your problem or, to be more time-efficient, use the graphical method until the point you need to find areas of more complicated shapes than rectangles and triangles.
You will need to have solved the loading segment to the left of your desired segment.
Write an equation for the loading w in the segment (see table XX above)
Integrate the loading equation \(w(x)\) to find the change in the shear V and include the shear value at the beginning of your loading segment including the influence of any point loads at that location (equivalent to the integration constant)
Integrate the shear equation \(w(x)\) to find the change in the bending moment M and include the moment value at the beginning of your loading segment including the influence of any point couple moments at that location (equivalent to the integration constant)
-
To find maximum values
For shear, use \(V(x)\) equation to compute
For moment, use \(M(x)\) to compute. If the value of the maximum moment is in the middle of a loading segment (often where the shear value is zero), set the \(V(x)=0\text{,}\) solve for x and then put that distance value into the moment \(M(x)\) equation. See the example below)
Subsection 8.4.5 Geogebra Interactives
You can use the interactives below to practice drawing shear and moment diagrams. You can change the position of the loads and change their magnitudes and observe how the diagrams change, or you can click New Problem to generate a new problem.
After exploring the diagrams and seeing how they relate to each other, turn off the solutions and try for yourself. You will very likely see problems like these on an exam.
Subsubsection Concentrated Forces
\(A\) and \(B\) are the supports. \(C\text{,}\) \(D\text{,}\) and \(E\) are the loads.
Subsubsection Concentrated Force and Moment
Subsubsection Distributed Load
\(A\) and \(F\) are the reaction forces.
Subsubsection Combination Load
\(A\) and \(F\) are the reaction forces.
Subsubsection Arbitrary Load
The load \(w\) is a function of \(x\text{.}\)
This applet uses the sign convention that positive loads act down, so